映像のみから脈拍を予測していきます
はじめに
今回はカメラを使った脈拍の測定について紹介します。以前、webカメラを使った健康診断ができないかと思った時に動作確認で実装しましたが、使わなかったのでその供養です。。
脈拍を取ることができれば、その脈の安定性からストレス状態を推測したり、健康状態をチェックしたりなどの応用が見込めます。
顔認識とfft(高速フーリエ変換)を使って実装します。
これを使うと脈拍も取れるのでこんな感じにも使えます。顔載せるのが躊躇われたのでこちらの記事で紹介した顔にモザイクを入れる処理を加えています。
脈拍予測
タイトルでは計測としていますが、実際やっていることとしては予測に近いかもしれません。まず、どのように脈拍を測定するのかという仕組みについてざっくりとですが説明します。
人間の体では脈を打ったタイミングで、動脈周りの色が変化します。人の目で見るとあまり変わったように感じませんが、機械的に定量化してみるとそこそこ数値が上下していることがわかります。
gifを見てみると一目瞭然なようにG(緑)の値が顕著に変化します。一方でR(赤)に関してはほぼ変化がありません。
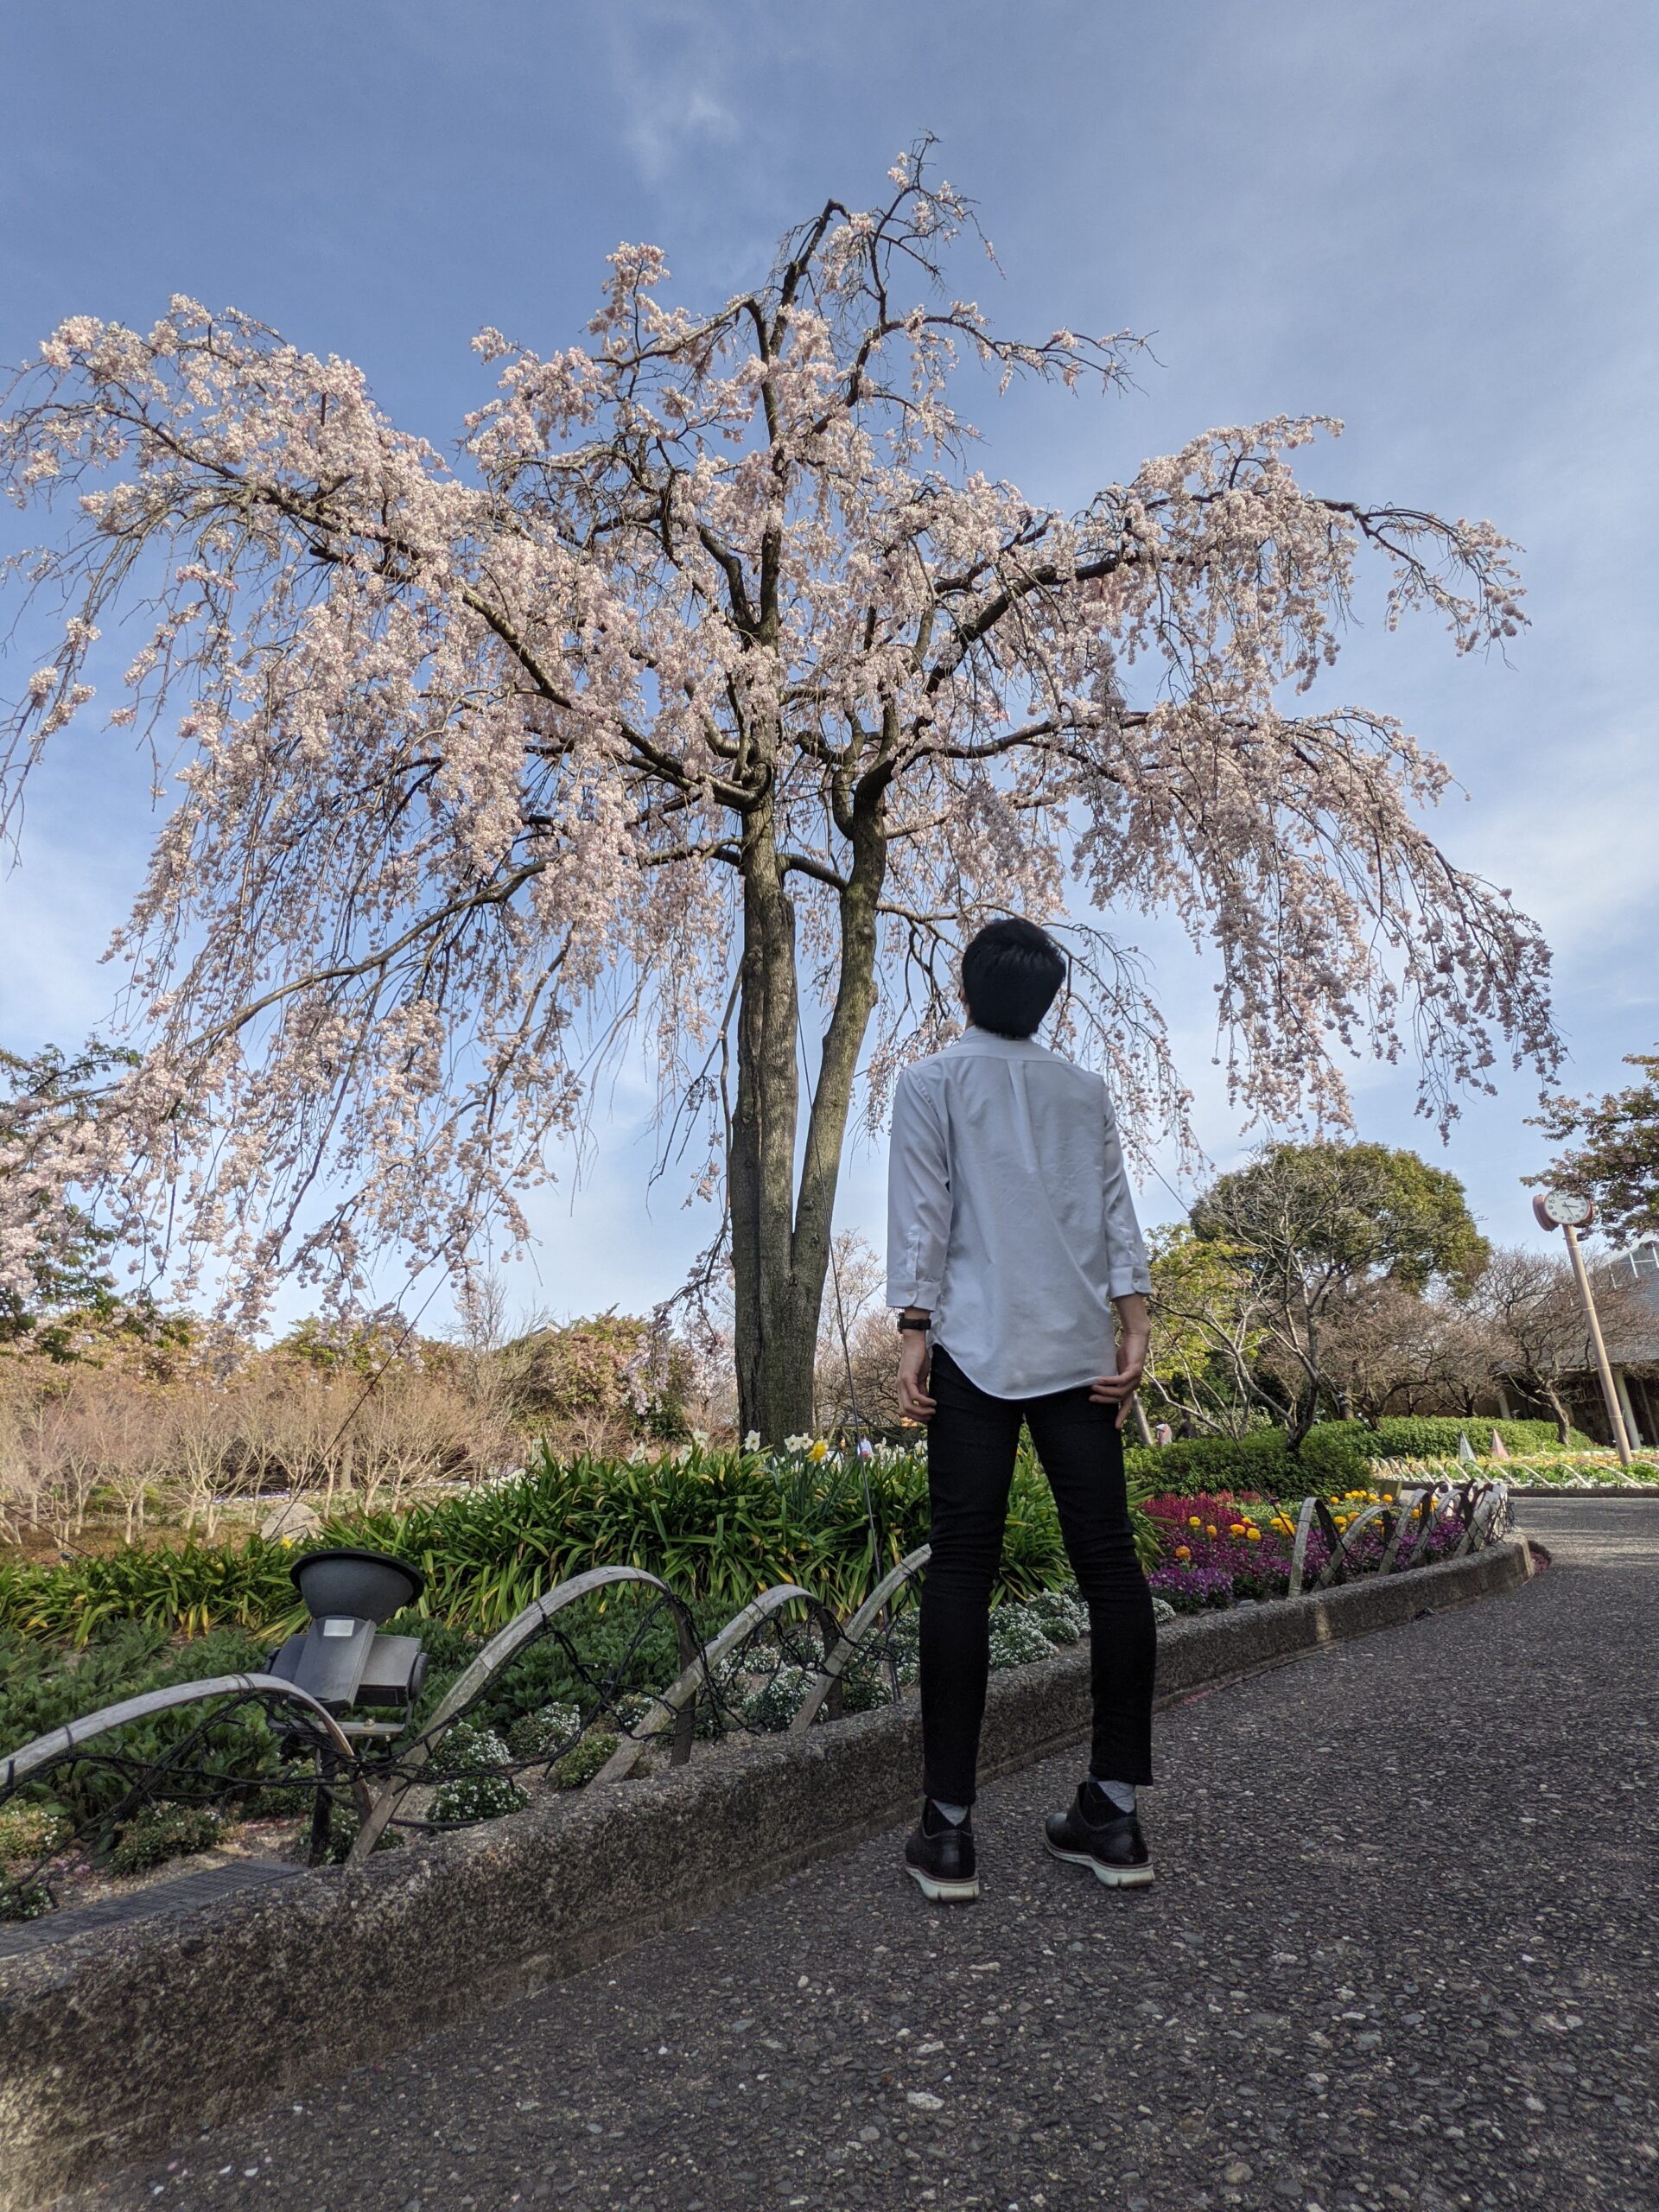
今回は顔の中でも色の変化がわかりやすく、影の影響が少なそうな鼻に着目します。
鼻におけるG(緑)の値において、数値が跳ねるタイミングを検出したいので、FFT(高速フーリエ変化)を使い、検出を行います。
結果
計測結果のログです。赤い丸がピーク値、つまり脈を打ったタイミングを検出したものです。体感にはなりますが、結構な精度(8割以上)で予測できているような気がします。
また、この値を使えば「はじめに」で載せているようなデモも作成できます。
コード
グラフ化にはpyqt5を使用しています。
# -*- coding: utf-8 -*-
import pyqtgraph as pg
from pyqtgraph.Qt import QtCore, QtGui, QtWidgets
import numpy as np
import sys
import cv2
from scipy import signal
from scipy import fftpack

from face import Face

capture = cv2.VideoCapture(0)
myFace = Face()

def get_gbr():
    ret, frame = capture.read()

    try:
        point = myFace.get_face_point(frame)
        nose = point[30]
        nose_color = frame[nose[1]][nose[0]]
        nose_area = frame[nose[1]-5:nose[1]+5,nose[0]-5:nose[0]+5]

        rsum,gsum,bsum = 0.0,0.0,0.0
        for raster in nose_area:
            for px in raster:
                rsum += px[2]
                gsum += px[0]
                bsum += px[1]
        # 平均値
        ravg = rsum / 100
        gavg = gsum / 100
        bavg = bsum / 100

        nose_ave = [gavg, bavg, ravg]

        print(f"R: {ravg}, G: {gavg}, B: {bavg}")

    # 顔が取得できなかった時の例外処理
    except:
        print('err')
        return [0,0,0]

    return nose_ave

class PlotGraph:
    def __init__(self):
        # UIを設定
        self.win = pg.GraphicsWindow(show=True)
        self.win.setWindowTitle('RGB plot')
        self.plt = self.win.addPlot()
        self.plt.setYRange(0, 255)
        self.curve_r = self.plt.plot(pen=(255, 0, 0))
        self.curve_g = self.plt.plot(pen=(0, 255, 0))
        self.curve_b = self.plt.plot(pen=(0, 0, 255))

        self.win2 = pg.GraphicsWindow(show=True)
        self.win2.setWindowTitle('Ro plot')
        self.plt2 = self.win2.addPlot()
        self.plt2.setYRange(0, 255)

        self.curve_g_smg = self.plt2.plot(pen=(0, 255, 255))
        self.curve_g_peak = self.plt2.plot(pen=(0, 255, 255))

        # データを更新する関数を呼び出す時間を設定
        self.timer = QtCore.QTimer()
        self.timer.timeout.connect(self.update)
        self.timer.start(100)

        self.data_r = np.zeros((100))
        self.data_g = np.zeros((100))
        self.data_b = np.zeros((100))
        self.data = []

    def update(self):
        self.data_r = np.delete(self.data_r, 0)
        self.data_g = np.delete(self.data_g, 0)
        self.data_b = np.delete(self.data_b, 0)
        gbr = get_gbr()

        self.data_r = np.append(self.data_r, gbr[2])
        self.data_g = np.append(self.data_g, gbr[0])
        self.data_b = np.append(self.data_b, gbr[1])
        self.data.append(gbr[0])

        self.curve_r.setData(self.data_r)
        self.curve_g.setData(self.data_g)
        self.curve_b.setData(self.data_b)

        window = 5 # 移動平均の範囲
        w = np.ones(window)/window
        x = np.convolve(self.data_g, w, mode='same')
        self.curve_g_smg.setData(x)

        N = 100
        threshold = 0.6 # 振幅の閾値

        x = np.fft.fft(self.data_g)
        x_abs = np.abs(x)
        x_abs = x_abs / N * 2
        x[x_abs < threshold] = 0

        x = np.fft.ifft(x)
        x = x.real # 複素数から実数部だけ取り出す
        self.curve_g_smg.setData(x)

        #ピーク値のインデックスを赤色で描画
        maxid = signal.argrelmax(x, order=3) #最大値
        minid = signal.argrelmin(x, order=1) #最小値
        self.curve_g_peak.setData(maxid, x[maxid], pen=None, symbol='o', symbolPen=None, symbolSize=4, symbolBrush=('r'))

if __name__ == "__main__":
    graphWin = PlotGraph()

    if (sys.flags.interactive != 1) or not hasattr(QtCore, 'PYQT_VERSION'):
        QtGui.QApplication.instance().exec_()
# -*- coding: utf-8 -*-
import cv2
import dlib
from imutils import face_utils
class Face():
def __init__(self):
self.detector = dlib.get_frontal_face_detector() #顔検出器の呼び出し.ただ顔だけを検出する
self.load_model()
def load_model(self, path="./model/shape_predictor_68_face_landmarks.dat"):
try:
self.predictor = dlib.shape_predictor(path) #顔から目鼻などランドマークを出力する
except Exception as e:
raise ValueError('can not load predict model.')
def get_face_point(self, frame):
gray = cv2.cvtColor(frame, cv2.COLOR_RGB2GRAY) #gray scaleに変換する
rects = self.detector(gray, 0) #grayから顔を検出
if not rects:
return
else:
#顔が認識できればポイントを特定
shape = self.predictor(gray, rects[0])
shape = face_utils.shape_to_np(shape)
return shapeおわりに
カメラだけで脈拍を計測できるということを知って、個人的にかなりびっくりしました。次はこれを使ってストレス値度合いの計測などをしてみようと思います。